
Recruitment teams are judged on outcomes they only partly control: the speed of hiring managers, the market, the offer. Good metrics separate what the team can influence from what it cannot, and show leadership where to act.
The five KPIs that matter most
| KPI | How to calculate it | What it tells you |
|---|---|---|
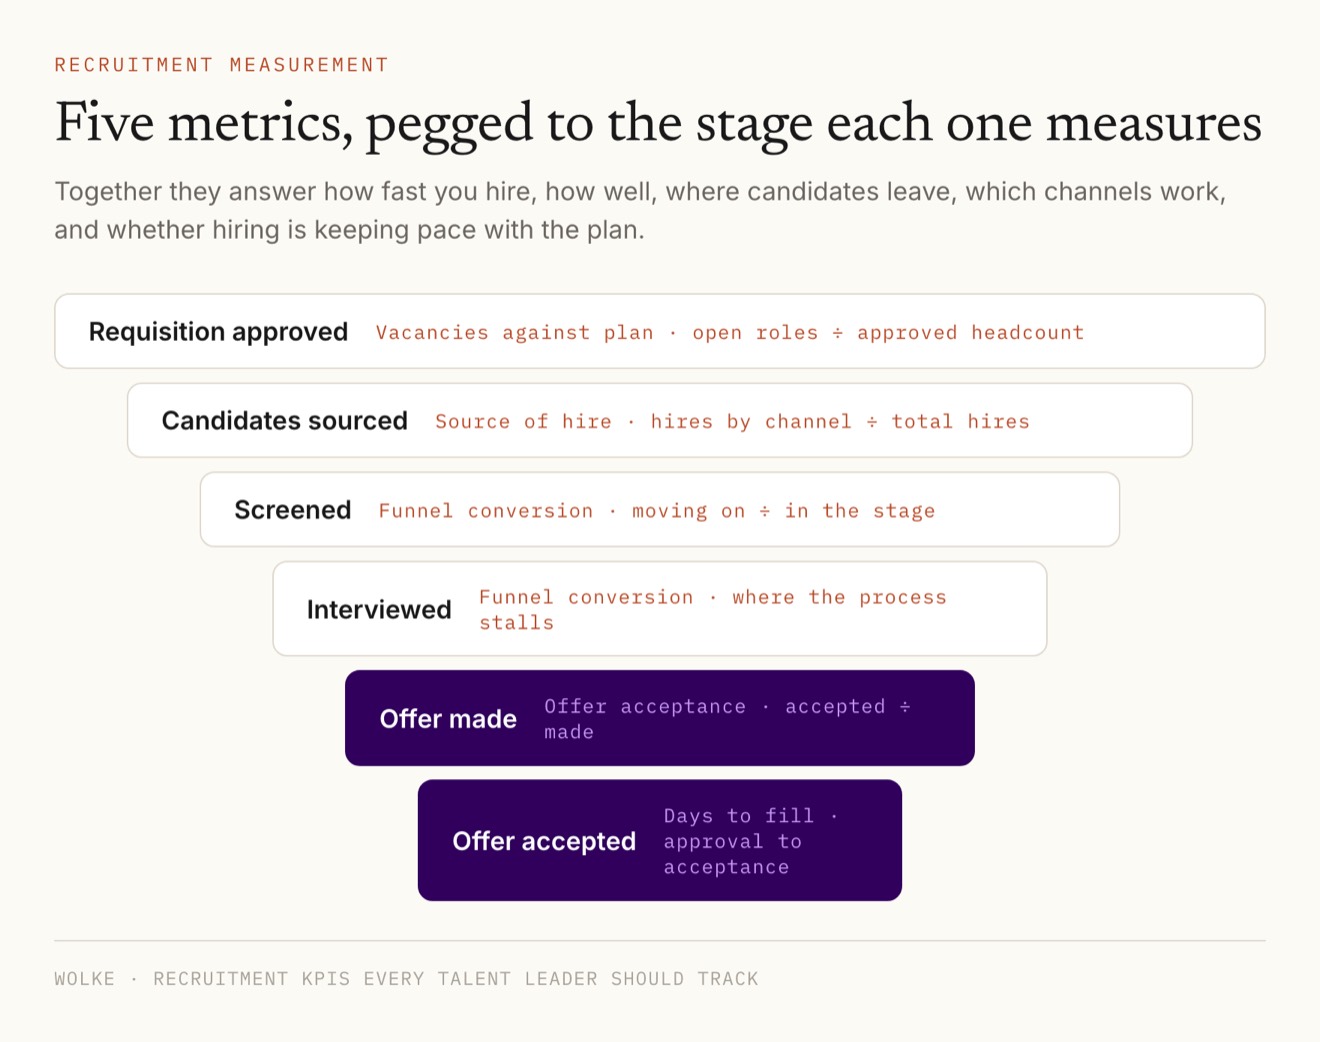
| Days to fill | Days from requisition approval to offer accepted | How long the business waits for a hire |
| Offer acceptance rate | Offers accepted ÷ offers made | Whether pay, process and employer brand land with candidates |
| Funnel conversion by stage | Candidates moving to the next stage ÷ candidates in the stage | Where candidates drop out, and where the process stalls |
| Source of hire | Hires by channel ÷ total hires | Which channels produce hires, not just applications |
| Vacancies against plan | Open roles ÷ roles in the approved headcount plan | Whether hiring keeps pace with the workforce plan |
Metrics worth adding
- Time in stage, which shows whether delay sits with recruiters, interviewers or approvers.
- Interview feedback turnaround, a common hidden cause of slow hiring.
- Quality of hire, measured later through performance and retention at six and twelve months.
- Cost per hire, by channel, including agency fees.
How to use them
- Report by role family and entity, because a group average hides where the problems are.
- Track the trend, not the snapshot. A month of long days to fill can be one hard role; three months is a pattern.
- Pair speed with quality. Faster is only better if the hires stay and perform.
- Connect hiring to the plan, so vacancies are measured against approved headcount, not a separate list.
Where the data comes from
These KPIs are only reliable when the requisition, the candidates, the interviews and the offers live in one system, and when the hire becomes the employee record rather than an export. Then the metric is a report, and nobody spends the first week of the quarter assembling it.
How to build a recruitment dashboard
Keep it to one screen. Leadership needs the five core KPIs, trended by month, split by role family and entity, with the vacancies against plan beside them. Recruiters need the same data one level down: their open requisitions, candidates by stage, and the interviews waiting for feedback.
How to calculate cost per hire
Add up the external costs, such as job boards, agency fees, assessments and background checks, and the internal costs, such as recruiter time and referral bonuses, for a period. Divide by the number of hires in the same period. Report it by channel too, because an expensive channel that produces people who stay can still be the best value.
The figure most teams leave out is the cost of the vacancy itself: the work not done while a role sits open, the cover or overtime that fills the gap, and the delivery that slips when someone starts later than planned. It is harder to pin down than an agency fee, and on a role that matters it is usually the larger number. Even a rough figure per role, agreed once with the budget holder, changes how a two week delay gets discussed.
Common mistakes when measuring recruitment
- Measuring from the wrong start date, such as the day the advert went live instead of the day the requisition was approved.
- Counting applications rather than hires when judging channels.
- Ignoring what happens after the hire. A fast hire who leaves in three months costs more than a slower one who stays.
- One number for the whole group, which hides the entity or role family where hiring is really struggling.
How to set your own benchmarks
Published benchmarks are of limited use. Days to fill for a warehouse supervisor in Sharjah and a financial controller in Riyadh are not the same number, and an average across both tells you nothing. The useful baseline is your own.
Take the last twelve months of hires, split them by role family and by entity, and take the median rather than the mean so that one unusually hard role does not distort the picture. That median is your baseline. From then on, the question is not whether you are above or below an industry figure, but whether you are improving against yourself, and where.
Set a target only where you can name the action that would move it. A target of thirty five days to fill is meaningless unless someone has agreed to shorten interview scheduling or speed up approvals.
Who owns each metric
A metric with no owner does not improve. The split that tends to work:
| Metric | Owner | Because |
|---|---|---|
| Days to fill | Shared, recruiter and hiring manager | Neither can move it alone |
| Time in stage | Whoever holds the stage | It localises the delay |
| Offer acceptance rate | Recruitment and reward together | Usually pay, sometimes process |
| Source of hire | Recruitment | They control the channel mix and the spend |
| Vacancies against plan | HR and finance | It is a planning question, not a hiring one |
| Quality of hire | The hiring manager | Only they see performance after month three |
Publishing the owner alongside the number changes the conversation in a review from explaining to deciding.
What to put in front of the board
Leadership does not want six charts. It wants to know whether hiring is keeping up with the plan, what it costs, and whether the people joining are staying. Three lines will usually do it: vacancies against approved headcount, median days to fill trended over four quarters, and twelve month retention of last year’s hires.
Bring the detail to the meeting in case it is asked for, and lead with the exception rather than the average. One role family at ninety days matters more than a group median that looks fine.
How often to review them
Weekly for the operational numbers, so that a stalled requisition is caught while it can still be rescued. Monthly for the trend. Quarterly for the ones that only make sense over time, such as quality of hire and cost per hire by channel.
Resist reporting everything at every cadence. A weekly pack that nobody reads is worse than three numbers that get acted on.
How Wolke reports these KPIs
Every metric above depends on the same thing: the pipeline and the hire being one record rather than two systems and a spreadsheet between them.
- The five, out of the system that produced them. Days to fill, offer acceptance, funnel conversion and vacancies against plan come from the recruiting data itself, not from a monthly export.
- Source of hire without the guesswork. Job board postings are tracked in one place and résumés arriving by email are parsed on landing with the channel recorded as a source.
- Vacancy against plan, properly. Headcount is raised against costed position codes and approved before a role exists, which is what makes the gap between plan and actual a real number.
- Numbers each leader can trust are theirs. Entity scoping holds in the dashboard charts too, so a divisional figure is that division’s figure.
- And the funnel itself is fed by AI. Résumés are parsed on arrival into structured records and candidates are ranked against the requisition, which is what makes conversion by stage a real measurement rather than an estimate of how much screening got done.
The reporting that comes with the pipeline is on the Recruitment page.